Given a recent increase in the number of bacteriophage genome sequenced- Nathan ( @NathanMB3) has updated the all-v-all comparison with more genomes (~5500 in total).Image at bottom of page
After reading the recent paper “MASH:fast genome and metagenome distance and estimation using MinHash” and meeting Nathan Brown at the University of Leicester, we discussed using MASH for identification of phage genomes and comparison thereof. The authors of the genome biology paper had included viruses in the microbial comparison in Figure 3 . Here we just focused on bacteriophage genomes.
For rapid identification of phage genomes we first constructed a database of phage genomes that were public. This included all phage genomes from the NCBI (ftp://ftp.ncbi.nlm.nih.gov/genomes/Viruses/all.fna.tar.gz) , which were then filtered to remove eukaryotic viruses. In addition phage genomes were collected from the phagesdb.org website. A sketch was made for all of these phages and collated, the mash database of this can be downloaded here.
We are using this database to rapidly identify newly sequenced phage isolates. This has worked well with the 100+ novel phages isolated so far and gives very similar results to blastn if there similar phage already in the database (it’s just quicker). We have found it to be good starting point for further comparative genomics.
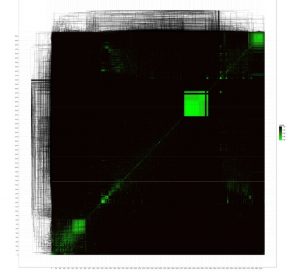
Using this database we then constructed an all-versus-all comparison of phage genomes. The advantage of MASH is that it allows this to be done in an extremely rapid manner. MASH outputs a text file with a Jaccard distance for each pair of genomes. The Jaccard distance is a measure of dissimilarity between genomes (on a scale of 0 to 1, where 0 is nearly identical and 1 is completely different), which we then plotted on a heatmap comparing all phages genomes. To do that we used the NeatMap package (Rajaram and Oono, BMC Bioinformatics 2011) in R to first arrange the phage genomes along the axes using an nMDS clustering algorithm with the Jaccard distances (Taguchi and Oono, Bioinformatics 2005) and then plot a heatmap. The ordering of the phage genomes and the hierarchical clustering shown on each axis are based on the nMDS results and are not the same as a phylogenetic/genomic tree.
Regardless, the clustered phage genomes shown by the green squares on the heatmap are – for the most part – related to each other according to existing phage taxonomy. This confirms that MASH coupled with nMDS clustering of Jaccard distances from MASH gives a good approximation of structure in the global phage population sequenced to date. Further analysis may reveal new patterns in the global phage population structure and illustrate the bias in phage sampling and sequencing. The dense green boxes in the top right are comprised of mycobacterium phages- which are by far the most numerically abundant in the database.
Below in Figure 1
Figure 1 “The known phage universe”. All versus all comparison of phage genomes.

The script for the clustering and production of heatmap can be found here
The list of phage on each axis is here
Below is the updated version with a larger number of genomes than in 2016. Not much has really changed, most phages still have limited similarity to other phages! just more of them . Still, many more phage genomes need to be sampled